
13.2: Trend Analysis of Financial Statements
- Page ID
- 916
\( \newcommand{\vecs}[1]{\overset { \scriptstyle \rightharpoonup} {\mathbf{#1}} } \)
\( \newcommand{\vecd}[1]{\overset{-\!-\!\rightharpoonup}{\vphantom{a}\smash {#1}}} \)
\( \newcommand{\dsum}{\displaystyle\sum\limits} \)
\( \newcommand{\dint}{\displaystyle\int\limits} \)
\( \newcommand{\dlim}{\displaystyle\lim\limits} \)
\( \newcommand{\id}{\mathrm{id}}\) \( \newcommand{\Span}{\mathrm{span}}\)
( \newcommand{\kernel}{\mathrm{null}\,}\) \( \newcommand{\range}{\mathrm{range}\,}\)
\( \newcommand{\RealPart}{\mathrm{Re}}\) \( \newcommand{\ImaginaryPart}{\mathrm{Im}}\)
\( \newcommand{\Argument}{\mathrm{Arg}}\) \( \newcommand{\norm}[1]{\| #1 \|}\)
\( \newcommand{\inner}[2]{\langle #1, #2 \rangle}\)
\( \newcommand{\Span}{\mathrm{span}}\)
\( \newcommand{\id}{\mathrm{id}}\)
\( \newcommand{\Span}{\mathrm{span}}\)
\( \newcommand{\kernel}{\mathrm{null}\,}\)
\( \newcommand{\range}{\mathrm{range}\,}\)
\( \newcommand{\RealPart}{\mathrm{Re}}\)
\( \newcommand{\ImaginaryPart}{\mathrm{Im}}\)
\( \newcommand{\Argument}{\mathrm{Arg}}\)
\( \newcommand{\norm}[1]{\| #1 \|}\)
\( \newcommand{\inner}[2]{\langle #1, #2 \rangle}\)
\( \newcommand{\Span}{\mathrm{span}}\) \( \newcommand{\AA}{\unicode[.8,0]{x212B}}\)
\( \newcommand{\vectorA}[1]{\vec{#1}} % arrow\)
\( \newcommand{\vectorAt}[1]{\vec{\text{#1}}} % arrow\)
\( \newcommand{\vectorB}[1]{\overset { \scriptstyle \rightharpoonup} {\mathbf{#1}} } \)
\( \newcommand{\vectorC}[1]{\textbf{#1}} \)
\( \newcommand{\vectorD}[1]{\overrightarrow{#1}} \)
\( \newcommand{\vectorDt}[1]{\overrightarrow{\text{#1}}} \)
\( \newcommand{\vectE}[1]{\overset{-\!-\!\rightharpoonup}{\vphantom{a}\smash{\mathbf {#1}}}} \)
\( \newcommand{\vecs}[1]{\overset { \scriptstyle \rightharpoonup} {\mathbf{#1}} } \)
\(\newcommand{\longvect}{\overrightarrow}\)
\( \newcommand{\vecd}[1]{\overset{-\!-\!\rightharpoonup}{\vphantom{a}\smash {#1}}} \)
\(\newcommand{\avec}{\mathbf a}\) \(\newcommand{\bvec}{\mathbf b}\) \(\newcommand{\cvec}{\mathbf c}\) \(\newcommand{\dvec}{\mathbf d}\) \(\newcommand{\dtil}{\widetilde{\mathbf d}}\) \(\newcommand{\evec}{\mathbf e}\) \(\newcommand{\fvec}{\mathbf f}\) \(\newcommand{\nvec}{\mathbf n}\) \(\newcommand{\pvec}{\mathbf p}\) \(\newcommand{\qvec}{\mathbf q}\) \(\newcommand{\svec}{\mathbf s}\) \(\newcommand{\tvec}{\mathbf t}\) \(\newcommand{\uvec}{\mathbf u}\) \(\newcommand{\vvec}{\mathbf v}\) \(\newcommand{\wvec}{\mathbf w}\) \(\newcommand{\xvec}{\mathbf x}\) \(\newcommand{\yvec}{\mathbf y}\) \(\newcommand{\zvec}{\mathbf z}\) \(\newcommand{\rvec}{\mathbf r}\) \(\newcommand{\mvec}{\mathbf m}\) \(\newcommand{\zerovec}{\mathbf 0}\) \(\newcommand{\onevec}{\mathbf 1}\) \(\newcommand{\real}{\mathbb R}\) \(\newcommand{\twovec}[2]{\left[\begin{array}{r}#1 \\ #2 \end{array}\right]}\) \(\newcommand{\ctwovec}[2]{\left[\begin{array}{c}#1 \\ #2 \end{array}\right]}\) \(\newcommand{\threevec}[3]{\left[\begin{array}{r}#1 \\ #2 \\ #3 \end{array}\right]}\) \(\newcommand{\cthreevec}[3]{\left[\begin{array}{c}#1 \\ #2 \\ #3 \end{array}\right]}\) \(\newcommand{\fourvec}[4]{\left[\begin{array}{r}#1 \\ #2 \\ #3 \\ #4 \end{array}\right]}\) \(\newcommand{\cfourvec}[4]{\left[\begin{array}{c}#1 \\ #2 \\ #3 \\ #4 \end{array}\right]}\) \(\newcommand{\fivevec}[5]{\left[\begin{array}{r}#1 \\ #2 \\ #3 \\ #4 \\ #5 \\ \end{array}\right]}\) \(\newcommand{\cfivevec}[5]{\left[\begin{array}{c}#1 \\ #2 \\ #3 \\ #4 \\ #5 \\ \end{array}\right]}\) \(\newcommand{\mattwo}[4]{\left[\begin{array}{rr}#1 \amp #2 \\ #3 \amp #4 \\ \end{array}\right]}\) \(\newcommand{\laspan}[1]{\text{Span}\{#1\}}\) \(\newcommand{\bcal}{\cal B}\) \(\newcommand{\ccal}{\cal C}\) \(\newcommand{\scal}{\cal S}\) \(\newcommand{\wcal}{\cal W}\) \(\newcommand{\ecal}{\cal E}\) \(\newcommand{\coords}[2]{\left\{#1\right\}_{#2}}\) \(\newcommand{\gray}[1]{\color{gray}{#1}}\) \(\newcommand{\lgray}[1]{\color{lightgray}{#1}}\) \(\newcommand{\rank}{\operatorname{rank}}\) \(\newcommand{\row}{\text{Row}}\) \(\newcommand{\col}{\text{Col}}\) \(\renewcommand{\row}{\text{Row}}\) \(\newcommand{\nul}{\text{Nul}}\) \(\newcommand{\var}{\text{Var}}\) \(\newcommand{\corr}{\text{corr}}\) \(\newcommand{\len}[1]{\left|#1\right|}\) \(\newcommand{\bbar}{\overline{\bvec}}\) \(\newcommand{\bhat}{\widehat{\bvec}}\) \(\newcommand{\bperp}{\bvec^\perp}\) \(\newcommand{\xhat}{\widehat{\xvec}}\) \(\newcommand{\vhat}{\widehat{\vvec}}\) \(\newcommand{\uhat}{\widehat{\uvec}}\) \(\newcommand{\what}{\widehat{\wvec}}\) \(\newcommand{\Sighat}{\widehat{\Sigma}}\) \(\newcommand{\lt}{<}\) \(\newcommand{\gt}{>}\) \(\newcommand{\amp}{&}\) \(\definecolor{fillinmathshade}{gray}{0.9}\)- Perform trend analysis to evaluate financial statement information.
Question: How is trend analysis used to evaluate the financial health of an organization?
Answer: Trend analysis evaluates an organization’s financial information over a period of time. Periods may be measured in months, quarters, or years, depending on the circumstances. The goal is to calculate and analyze the amount change and percent change from one period to the next.
For example, in fiscal years 2010 and 2009, Coca-Cola had the operating income shown as follows. (Amounts are in millions. To convert to the actual amount, simply multiply the amount given times one million. For example, $8,449 × 1,000,000 = $8,449,000,000. Thus Coca-Cola had operating income of $8,449,000,000 in 2010.)
| Amount 2010 | Amount 2009 | Amount Change | Percent Change | |
| Operating income | $8,449 | $8,231 | ? | ? |
Although readers of the financial information can see that operating income increased from 2009 to 2010, the exact dollar amount of the change and the percent change is more helpful in evaluating the company’s performance. The dollar amount of change is calculated as follows:
Key Equation
Amount of change = Current year amount – Base year amount
Question: As you can see, operating income increased by $218,000,000 from 2009 to 2010. Is this a significant increase for Coca-Cola?
Answer: Most of us consider $218,000,000 to be a huge amount, but the only way to gauge the true significance of this amount for Coca-Cola is to calculate the percent change from 2009 to 2010. The percent change is calculated as the current year amount minus the base year amount, divided by the base year amount.
Key Equation
Percent change = (Current year amount – Base year amount) ÷ Base year amount
The calculation that follows shows operating income increased 2.6 percent from 2009 to 2010. Although not an extraordinarily significant increase, this does represent positive results for Coca-Cola.
Trend Analysis for the Income Statement and Balance Sheet
Question: Trend analysis is often used to evaluate each line item on the income statement and balance sheet. How is this analysis prepared?
Answer: Figure 13.1 shows Coca-Cola’s income statement trend analysis, and Figure 13.2 shows Coca-Cola’s balance sheet trend analysis. Carefully examine each of these figures, including the comments.
Figure 13.1 Income Statement Trend Analysis for Coca-Cola
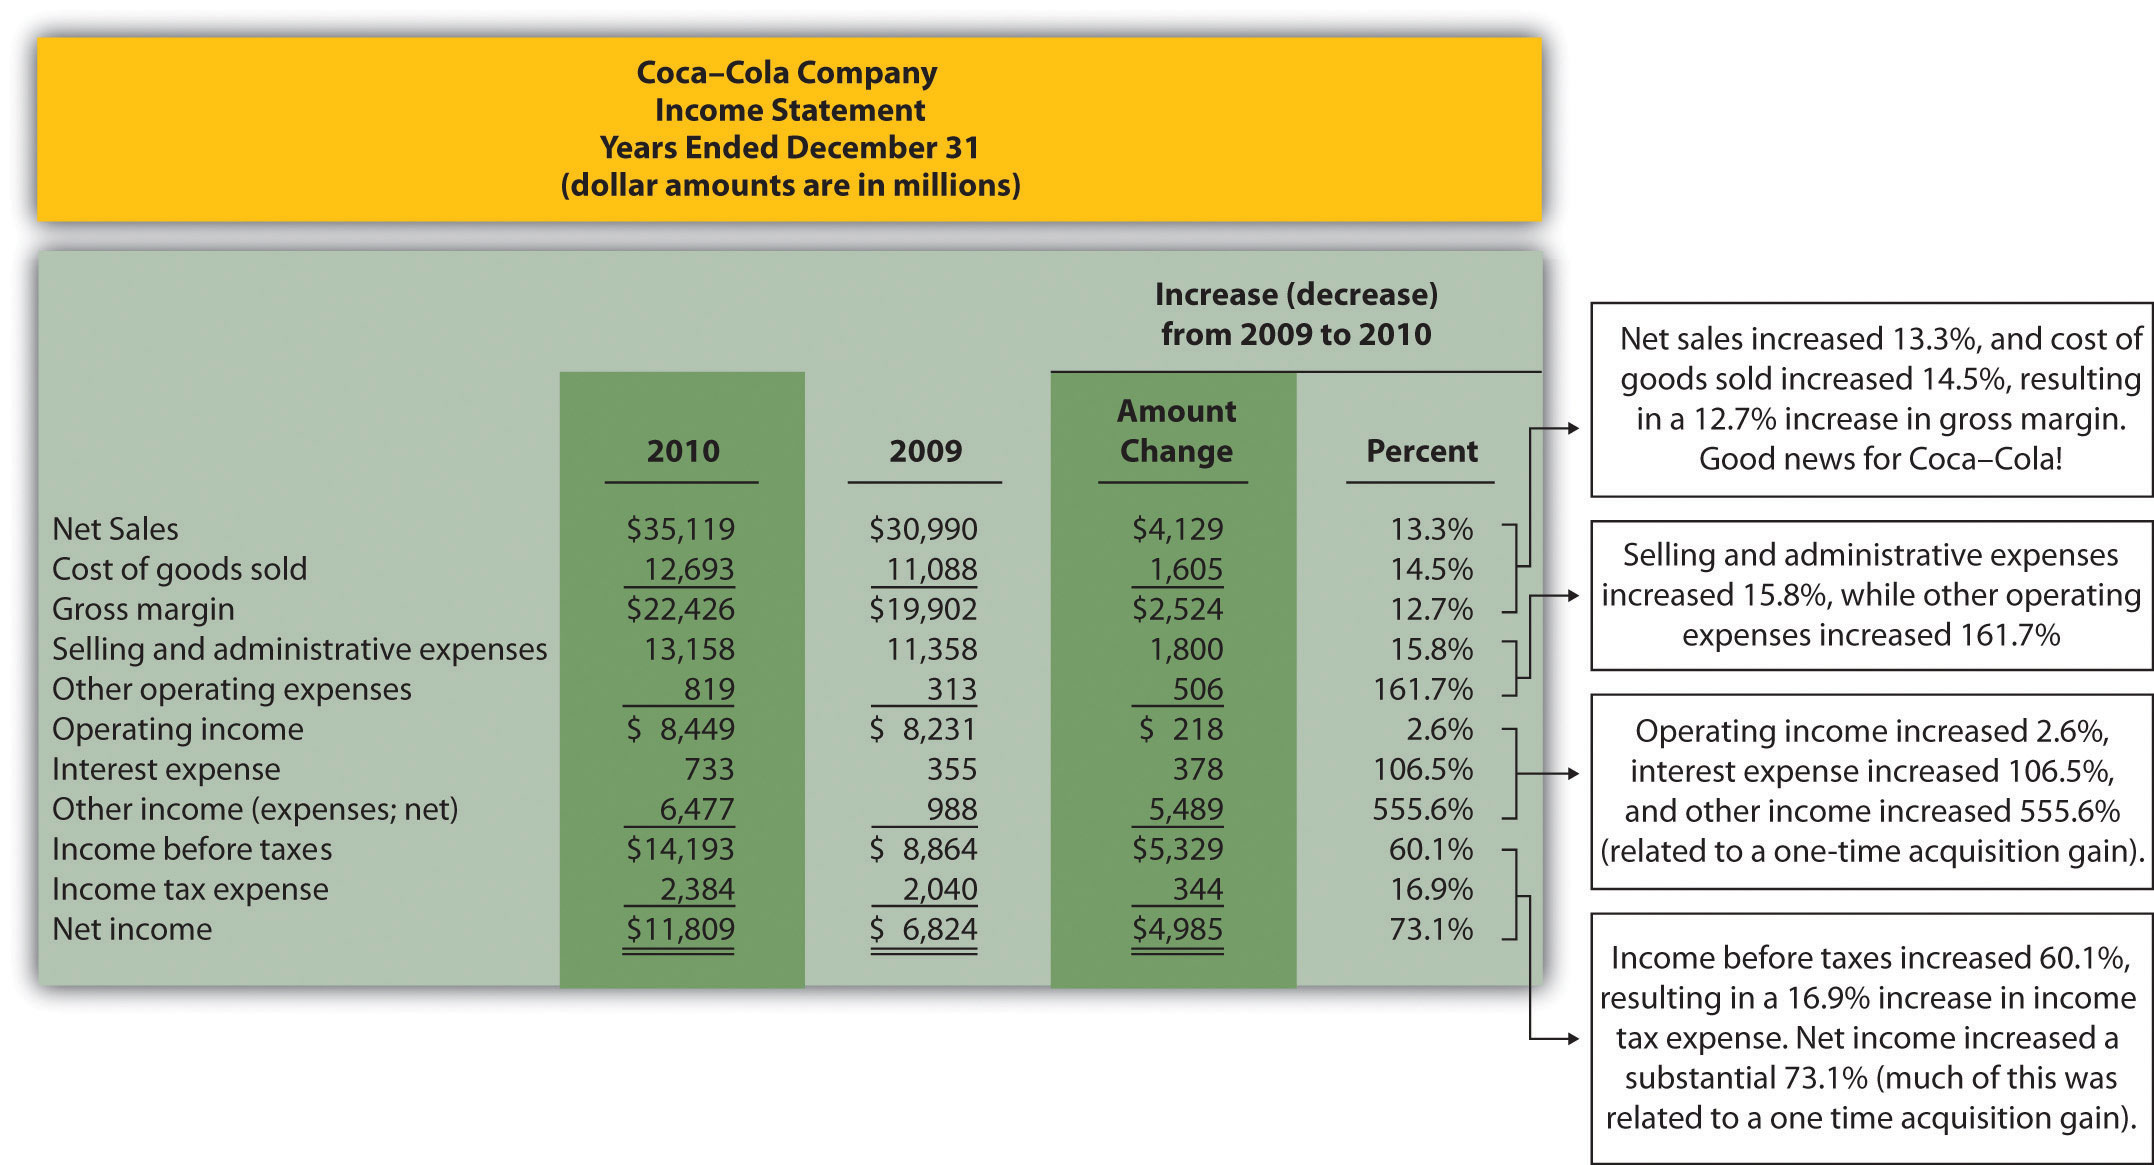
Note: Percent change for each line item is found by dividing the increase (decrease) amount by the 2009 amount. For example, net sales 13.3 percent increase equals $4,129 ÷ $30,990.
Figure 13.1 shows that net sales increased by $4,129,000,000, or 13.3 percent. Cost of goods sold had a corresponding increase of $1,605,000,000, or 14.5 percent. The increase in net sales and related increase in cost of goods sold resulted in an increase in gross margin of $2,524,000,000, or 12.7 percent. The increase in selling and administrative expenses of $1,800,000,000, or 15.8 percent, outpaced the increase in net sales, resulting in a relatively small increase in operating income of $218,000,000, or 2.6 percent. The significant increase in other income (expenses), net of 555.6 percent relates to a one-time gain of $4,978,000,000 resulting from Coca-Cola’s acquisition of Coca-Cola Enterprises, Inc., in 2010 (this information comes from the notes to the financial statements). This one-time gain caused an unusually large increase in net income for 2010. This is important as we continue our analysis of Coca-Cola Company throughout the chapter. Net income will appear to have an unusually large increase as we cover various measures of performance, but keep in mind that the one-time gain in 2010 of $4,978,000,000 caused most of the increase from 2009 to 2010.
Figure 13.2 Balance Sheet Trend Analysis for Coca-Cola
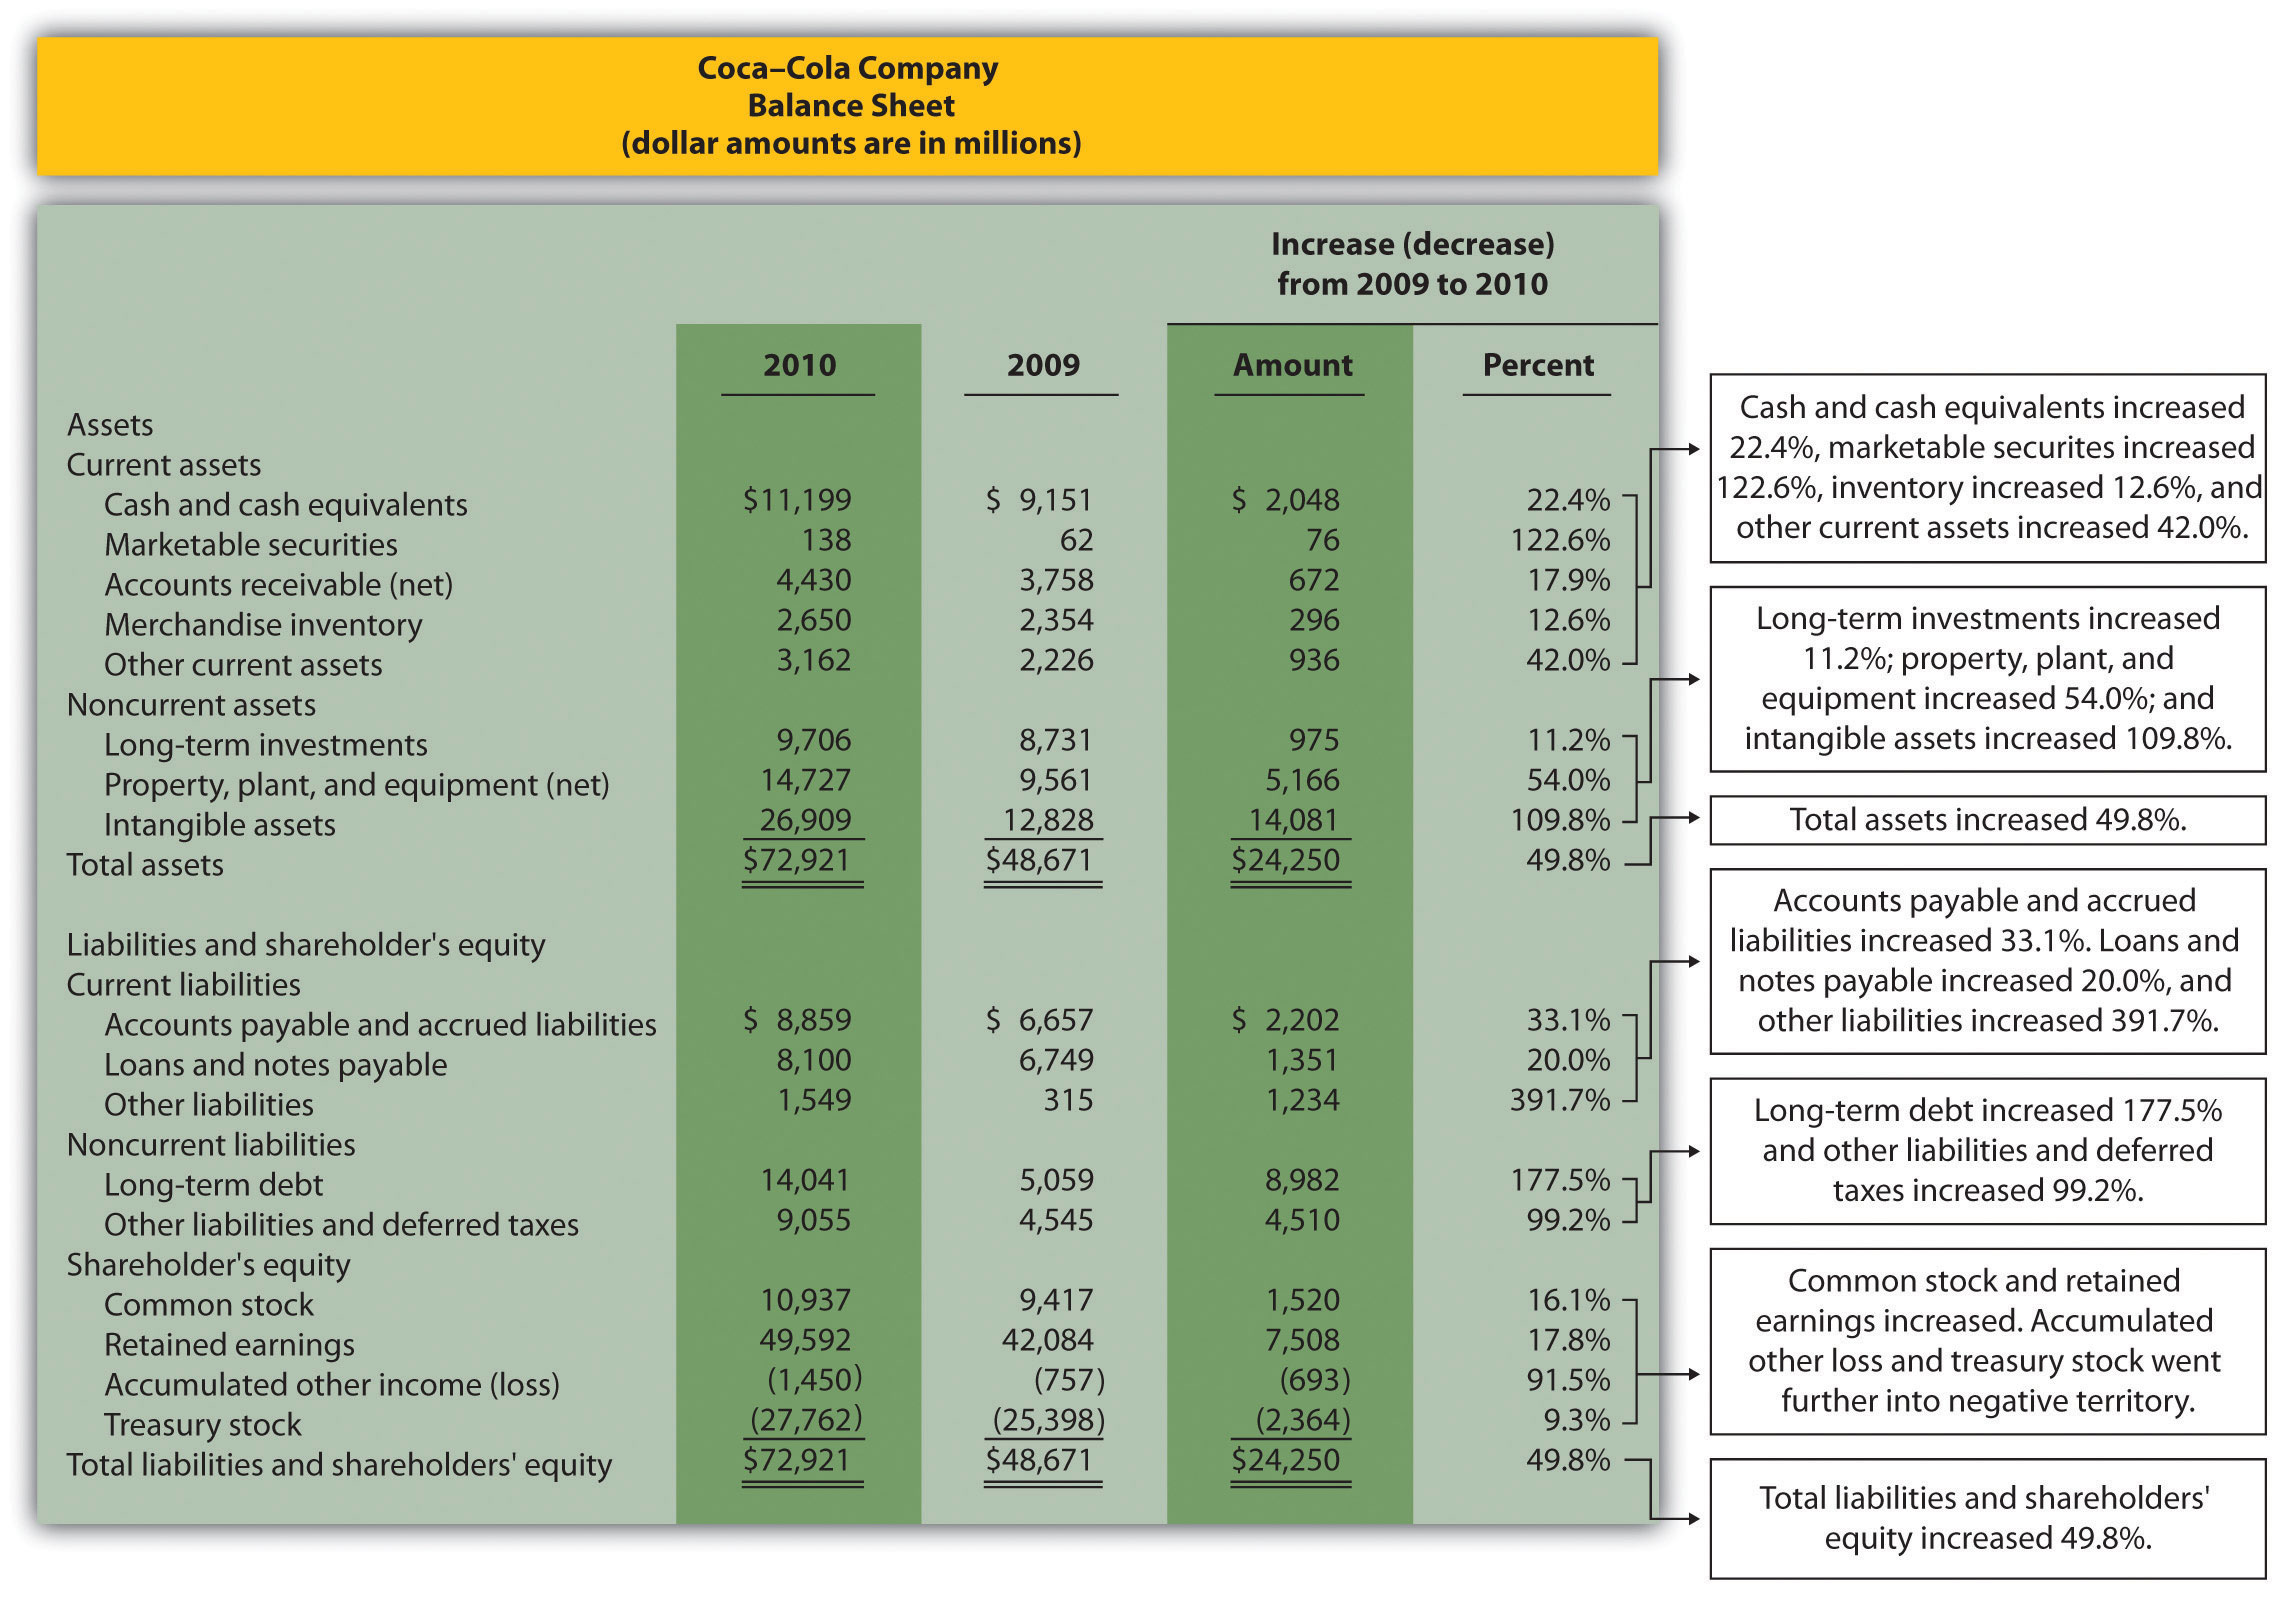
Note: Percent change for each line item is found by dividing the increase (decrease) amount by the 2009 amount. For example, cash and cash equivalents 22.4 percent increase equals $2,048 ÷ $9,151.
Current Assets and Current Liabilities
Question: What does the balance sheet trend analysis in Figure 13.2 tell us about current assets and current liabilities for Coca-Cola?
Answer: Figure 13.2 shows that cash and cash equivalents increased by $2,048,000,000, or 22.4 percent. Coca-Cola’s statement of cash flows would provide detailed information regarding this increase. (Chapter 12 covers the statement of cash flows.) Marketable securities increased 122.6 percent, accounts receivable increased 17.9 percent, and merchandise inventory increased 12.6 percent. Other current assets increased 42.0 percent.
Moving to current liabilities, accounts payable and accrued liabilities increased by 33.1 percent, loans and notes payable increased 20.0 percent, and other current liabilities decreased 391.7 percent (mostly attributable to a significant increase in the current portion of long-term debt).
Noncurrent Assets and Noncurrent Liabilities
Question: What does the balance sheet trend analysis in Figure 13.2 tell us about noncurrent assets and noncurrent liabilities for Coca-Cola?
Answer: Figure 13.2 shows that long-term investments increased 11.2 percent. Property, plant, and equipment increased 54.0 percent, and intangible assets increased by a significant 109.8 percent. Both items appearing under noncurrent liabilities increased, with a 177.5 percent increase in long-term debt and a 99.2 percent increase in other liabilities and deferred taxes.
Shareholders’ Equity
Question: What does the balance sheet trend analysis in Figure 13.2 tell us about shareholders’ equity for Coca-Cola?
Answer: Common stock increased 16.1 percent, and retained earnings increased 17.8 percent. Accumulated other income (loss) went further into negative territory by 91.5 percent, and treasury stock increased 9.3 percent.
Big Picture Balance Sheet Trend Analysis
Question: What are some of the key big picture items identified in the balance sheet trend analysis shown in Figure 13.2?
Answer: Overall, total assets increased by $24,250,000,000, or 49.8 percent. Of course, total liabilities and shareholders’ equity also increased by the same amount. The increases identified in almost every asset, liability, and shareholders’ equity line item are significant. From reading the notes to the financial statements, the authors were able to identify the main source of these increases. In 2010, Coca-Cola acquired the remaining 67 percent of Coca-Cola Enterprises, Inc.’s (CCE) North America business that Coca-Cola did not already own. This resulted in significant increases in noncurrent assets and noncurrent liabilities, which were acquired as part of this transaction. It also resulted in the reporting of a one-time gain on the income statement of $4,978,000,000, which came from Coca-Cola remeasuring its equity interest in CCE to fair value upon close of the transaction in 2010.
This analysis points to the reason we perform trend analysis—to identify the increases and decreases in dollar amounts from one year to the next and to take a close look at unusual trends.
Trend Analysis over Several Years
Question: The trend analysis just described works well when comparing financial data for two years. However, many prefer to review trends over more than two years. How might a trend analysis for several years be prepared?
Answer: A common approach is to establish the oldest year as the base year and compute future years as a percentage of the base year. For example, Coca-Cola had the following net sales and operating income for each of the past five years (in millions):
| 2010 | 2009 | 2008 | 2007 | 2006 | |
|---|---|---|---|---|---|
| Net sales | $35,119 | $30,990 | $31,944 | $28,857 | $24,088 |
| Operating income | $ 8,449 | $ 8,231 | $ 8,446 | $ 7,252 | $ 6,308 |
Assuming 2006 is the base year, the trend percentage is calculated for each year using the following formula:
Key Equation
Trend percentage = Current year ÷ Base year
Figure 13.3 shows Coca-Cola’s trend percentages for net sales and operating income. Most analysts would expand this analysis to include most, if not all, of the income statement line items.
Figure 13.3 Percentage Trend Analysis for Coca-Cola
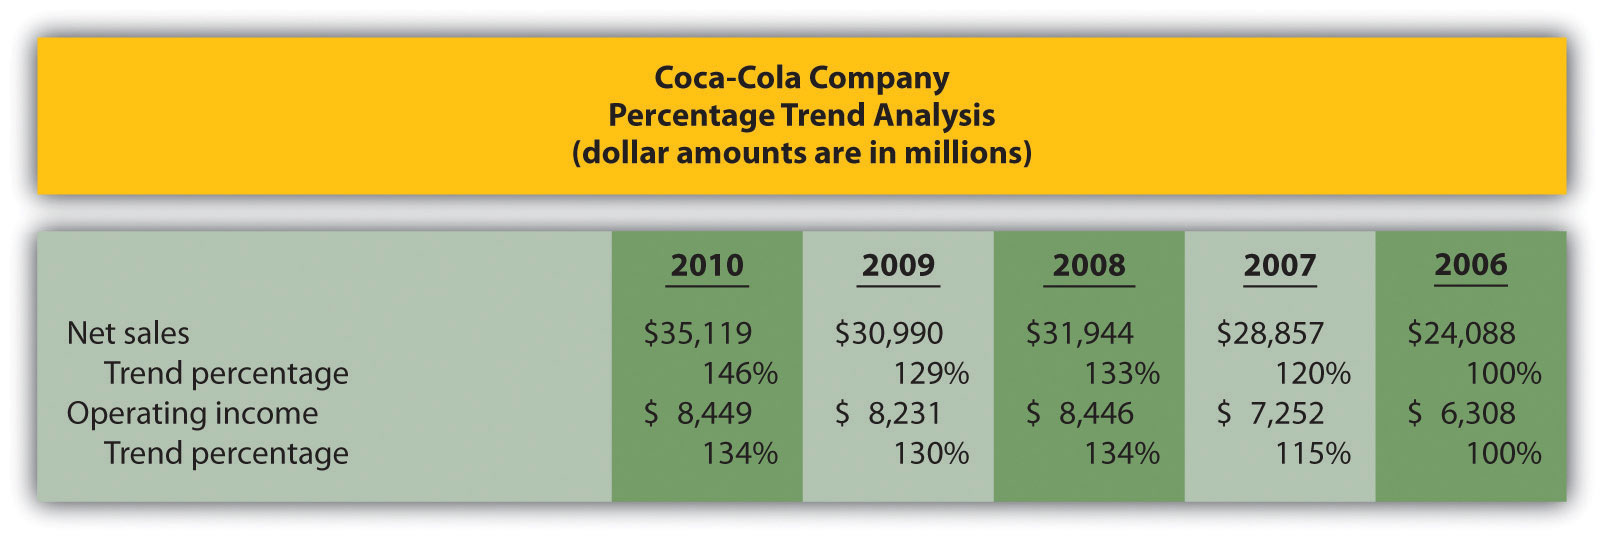
Note: Trend percentages are calculated as the current year divided by the base year (2006). For example, the net sales 2010 trend percentage of 146 percent equals $35,119 (net sales for 2010) divided by $24,088 (net sales for the base year 2006).
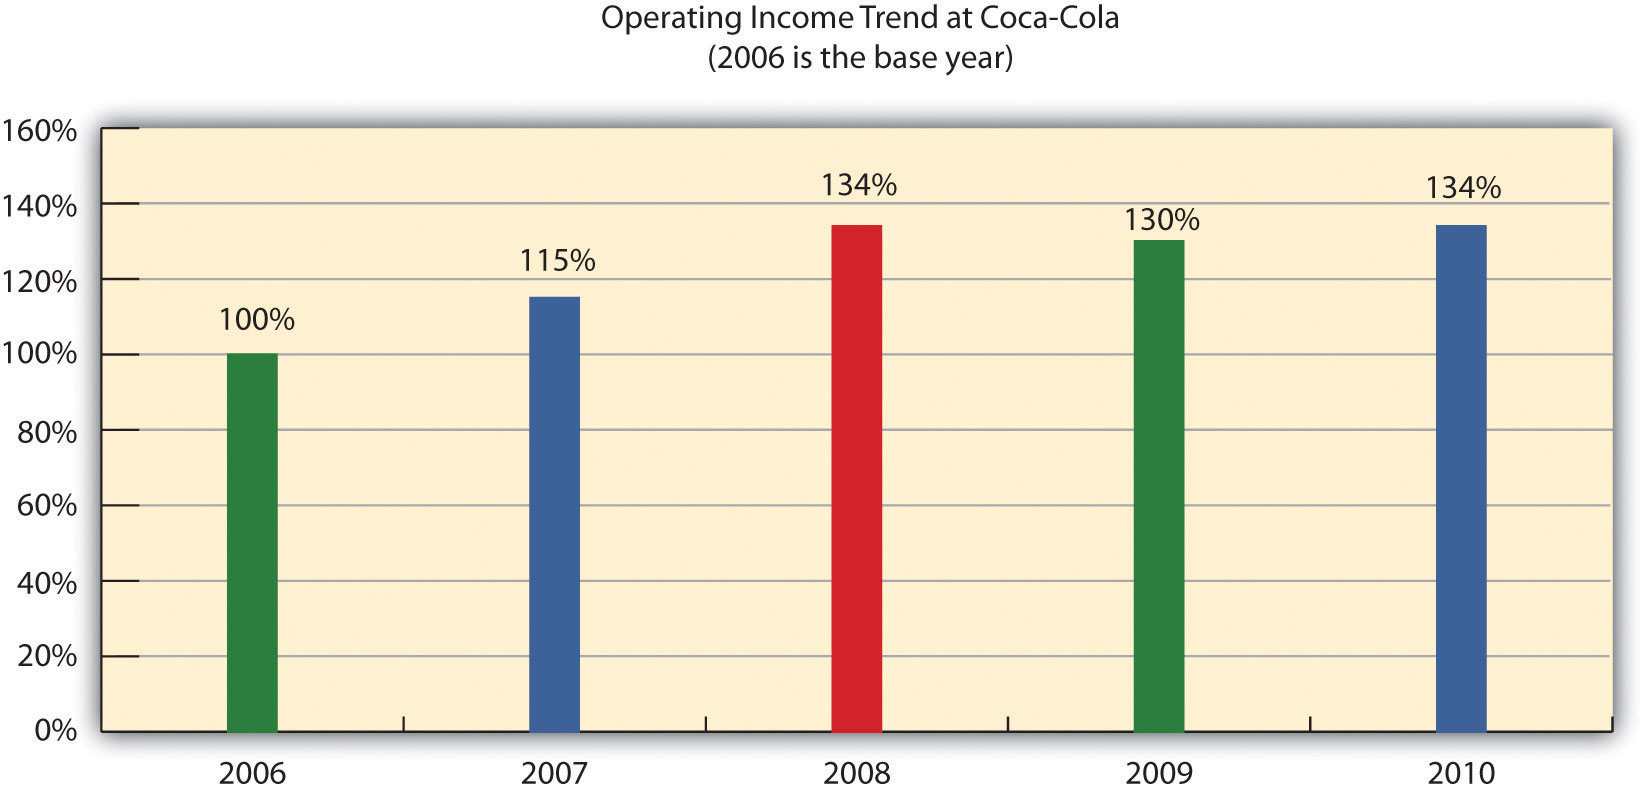
All percentages shown in Figure 13.3 are relative to the base year, which is fiscal year 2006. Notice that the increase in operating income of 34 percent (= 134 percent – 100 percent) from 2006 to 2010 was less than the increase in net sales of 46 percent for the same period. This signals that the increase in Coca-Cola’s operating expenses outpaced the increase in net sales during this period. Figure 13.4 shows the trend percentages in Coca-Cola’s operating income from 2006 to 2010.
Figure 13.4 Five-Year Percentage Trend in Operating Income for Coca-Cola
Key Takeaways
- Trend analysis provides a means to analyze company data over a period of time by focusing on the change in specific line items within the income statement and balance sheet. Changes are typically measured in dollars and percentages. Trends over several years can be evaluated by calculating the trend percentage as the current year divided by the base year.
Business in Action 13.1
Trends Presented in Annual Reports
Most public companies present trend information in their annual reports. For example, Intel shows net revenues, gross margin, research and development costs, operating income, and net income for the past five years. Nike and PepsiCo both show the percent change in selected income statement line items for the past two years. Costco Wholesale Corporation presents selected income statement information for the past five years. The fact that these financial data are provided in the annual report confirms the importance of presenting trend information to shareholders.
Sources: Intel, “Annual Report, 2010,” http://www.intel.com; Nike, “Annual Report, 2010,” http://www.nike.com; PepsiCo, “Annual Report, 2010,” http://www.pepsico.com; Costco Wholesale Corporation, “Annual Report, 2010,” www.costco.com.
REVIEW PROBLEM 13.1
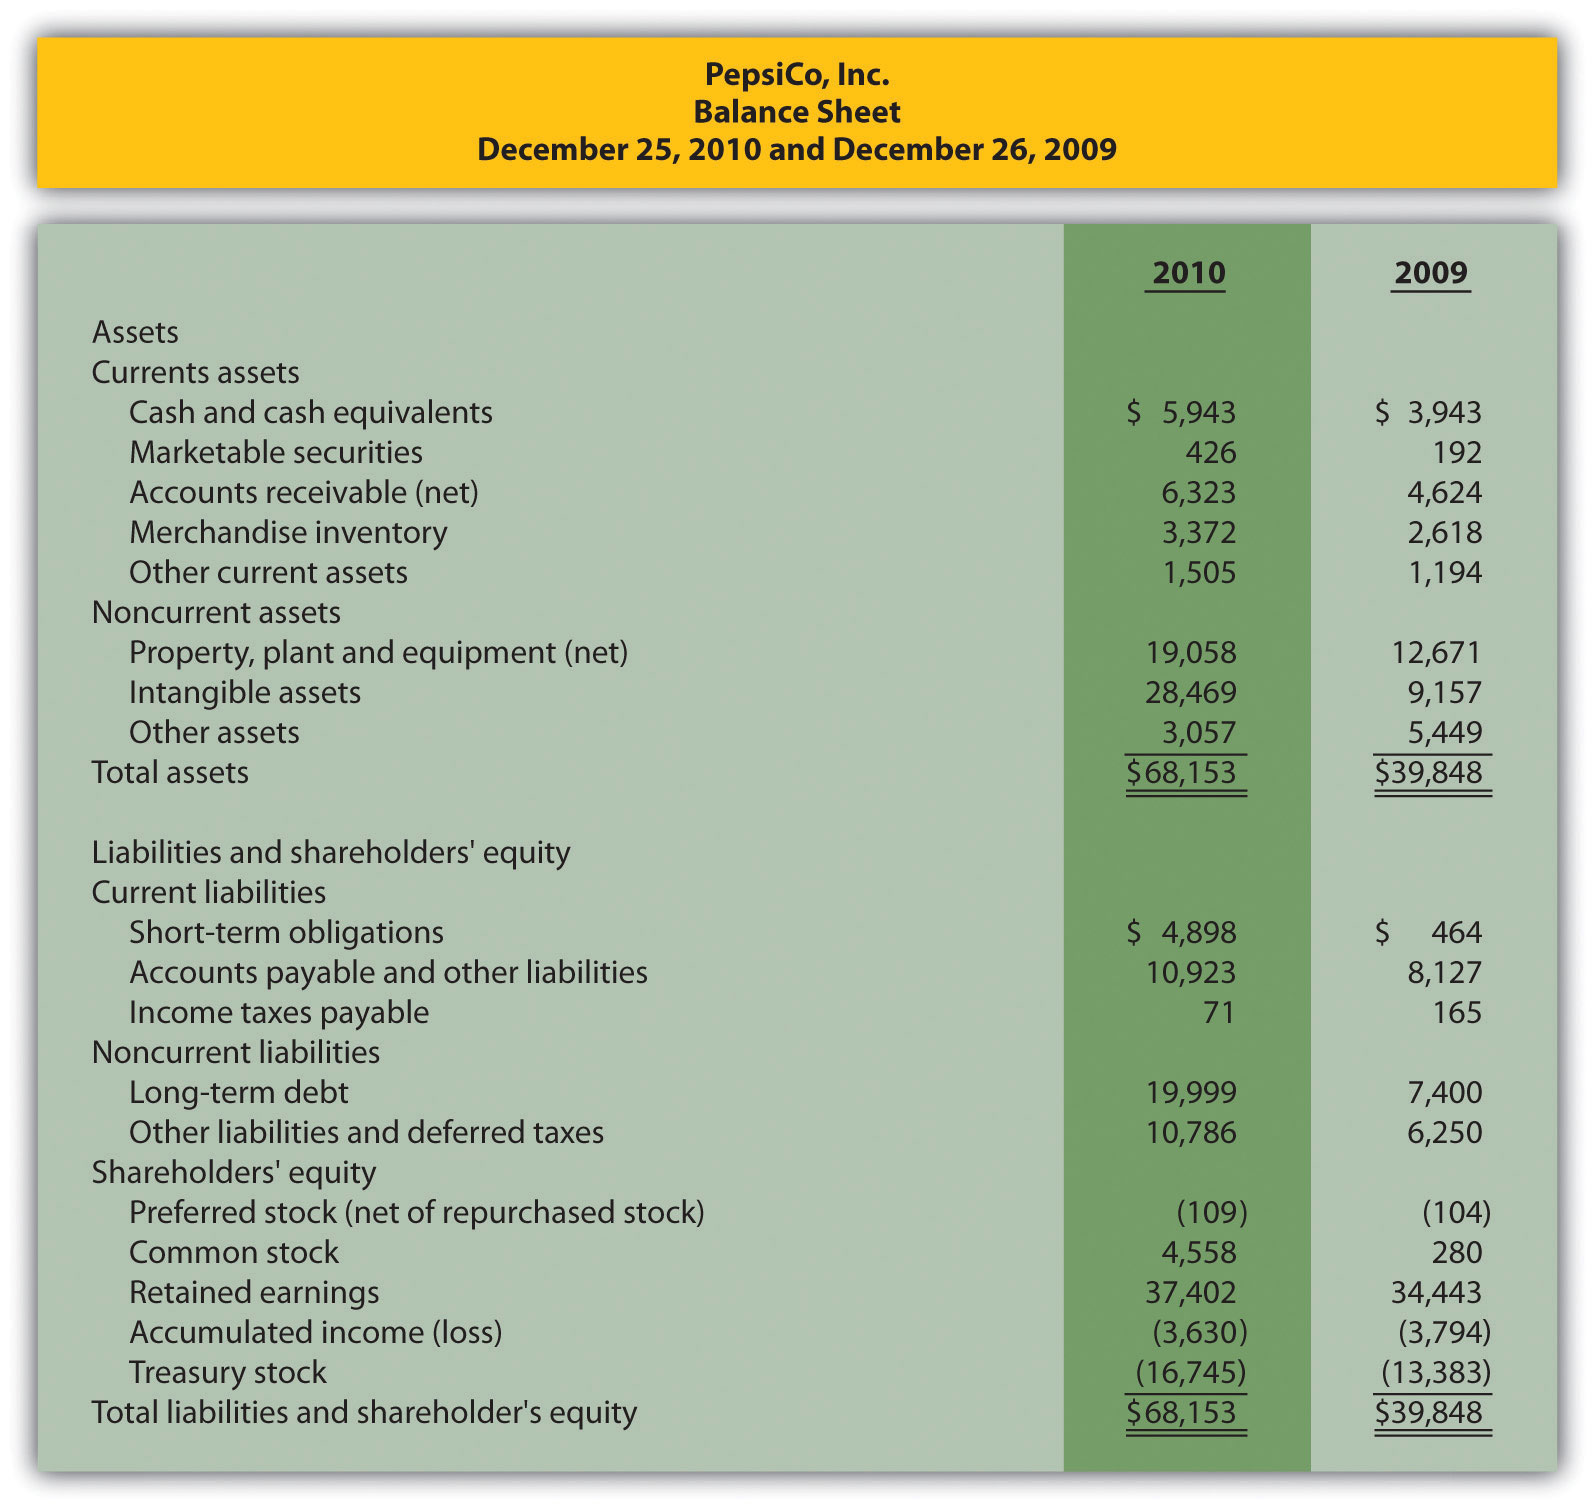
The following income statements and balance sheets are for PepsiCo, Inc. We use this information in review problems throughout the chapter.
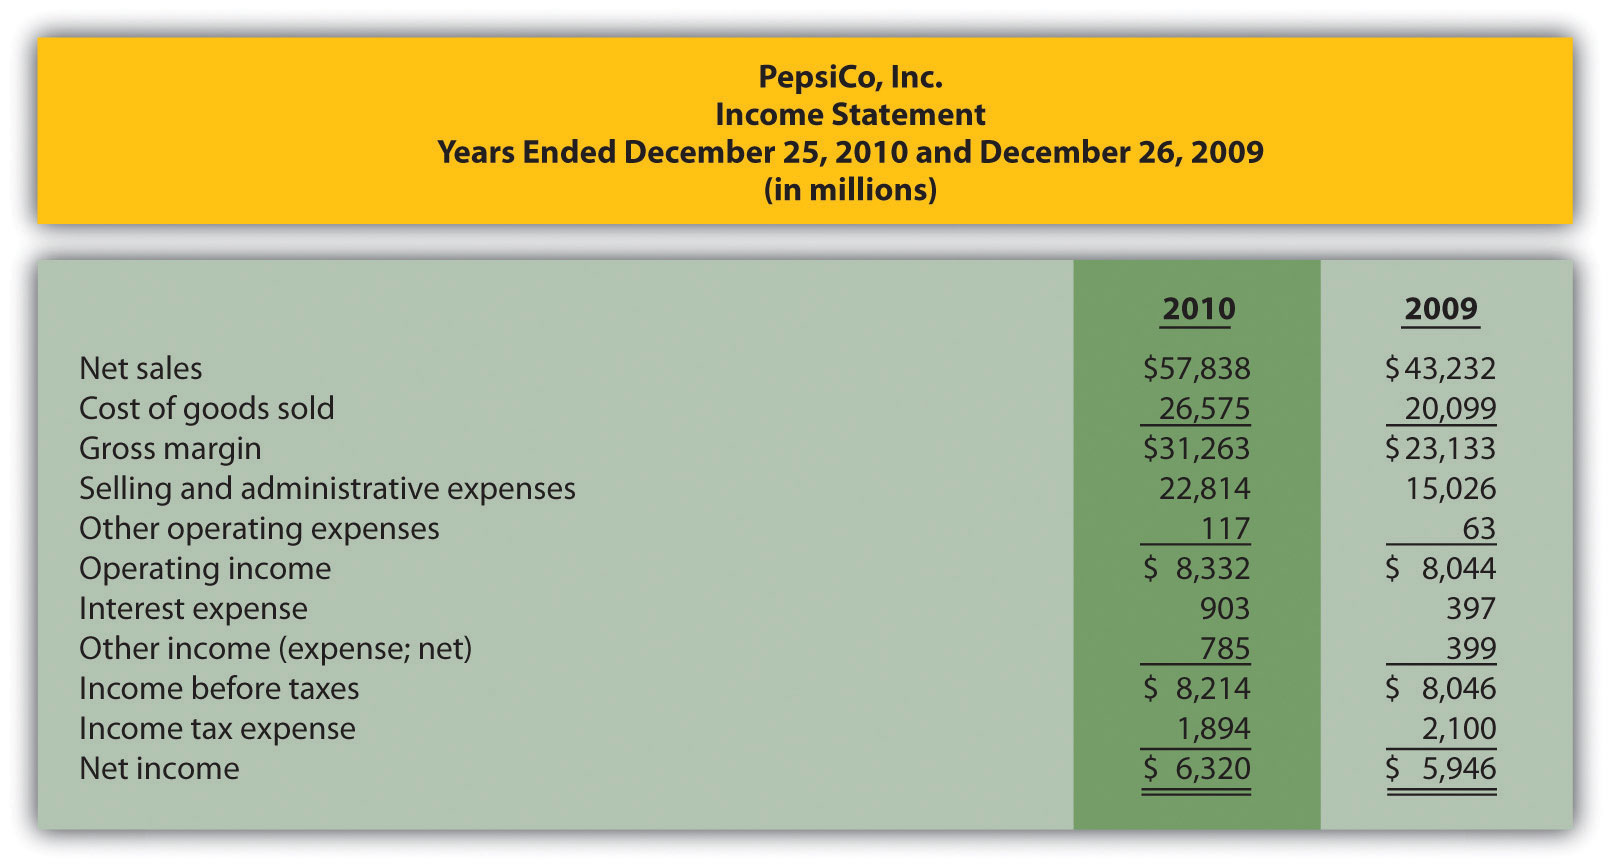
- Prepare a trend analysis for PepsiCo‘s income statement using the format shown in Figure 13.1.
- Prepare a trend analysis for PepsiCo’s balance sheet using the format shown in Figure 13.2.
- Compare PepsiCo’s increase in net income from 2009 to 2010 to Coca-Cola’s increase shown in Figure 13.1. Which company has the highest percentage growth in net income?
- Compare PepsiCo’s increase in total assets from 2009 to 2010 to Coca-Cola’s increase shown in Figure 13.2. Which company has the highest percentage growth in total assets?
Solution to Review Problem 13.1
- Note: Percent change for each line item is found by dividing the increase (decrease) amount by the 2009 amount. For example, net sales 33.8 percent increase equals $14,606 ÷ $43,232.
- Note: Percent change for each line item is found by dividing the increase (decrease) amount by the 2009 amount. For example, cash and cash equivalents 50.7 percent increase equals $2,000 ÷ $3,943.
- Net income at PepsiCo increased $374,000,000, or 6.3 percent, while net income at Coca-Cola increased $4,985,000,000, or 73.1 percent (as shown in Figure 13.1). Thus Coca-Cola’s growth in net income far exceeded that of PepsiCo. As mentioned earlier, this huge increase in Coca-Cola’s net income is largely attributable to a one-time gain in 2010 of $4,978,000,000.
- Total assets at PepsiCo increased $28,305,000,000, or 71.0 percent, while total assets at Coca-Cola increased $24,250,000,000, or 49.8 percent (as shown in Figure 13.2). Thus PepsiCo’s growth in total assets far exceeded that of Coca-Cola.