
12.6: Analyzing Cash Flow Information
- Page ID
- 913
\( \newcommand{\vecs}[1]{\overset { \scriptstyle \rightharpoonup} {\mathbf{#1}} } \)
\( \newcommand{\vecd}[1]{\overset{-\!-\!\rightharpoonup}{\vphantom{a}\smash {#1}}} \)
\( \newcommand{\dsum}{\displaystyle\sum\limits} \)
\( \newcommand{\dint}{\displaystyle\int\limits} \)
\( \newcommand{\dlim}{\displaystyle\lim\limits} \)
\( \newcommand{\id}{\mathrm{id}}\) \( \newcommand{\Span}{\mathrm{span}}\)
( \newcommand{\kernel}{\mathrm{null}\,}\) \( \newcommand{\range}{\mathrm{range}\,}\)
\( \newcommand{\RealPart}{\mathrm{Re}}\) \( \newcommand{\ImaginaryPart}{\mathrm{Im}}\)
\( \newcommand{\Argument}{\mathrm{Arg}}\) \( \newcommand{\norm}[1]{\| #1 \|}\)
\( \newcommand{\inner}[2]{\langle #1, #2 \rangle}\)
\( \newcommand{\Span}{\mathrm{span}}\)
\( \newcommand{\id}{\mathrm{id}}\)
\( \newcommand{\Span}{\mathrm{span}}\)
\( \newcommand{\kernel}{\mathrm{null}\,}\)
\( \newcommand{\range}{\mathrm{range}\,}\)
\( \newcommand{\RealPart}{\mathrm{Re}}\)
\( \newcommand{\ImaginaryPart}{\mathrm{Im}}\)
\( \newcommand{\Argument}{\mathrm{Arg}}\)
\( \newcommand{\norm}[1]{\| #1 \|}\)
\( \newcommand{\inner}[2]{\langle #1, #2 \rangle}\)
\( \newcommand{\Span}{\mathrm{span}}\) \( \newcommand{\AA}{\unicode[.8,0]{x212B}}\)
\( \newcommand{\vectorA}[1]{\vec{#1}} % arrow\)
\( \newcommand{\vectorAt}[1]{\vec{\text{#1}}} % arrow\)
\( \newcommand{\vectorB}[1]{\overset { \scriptstyle \rightharpoonup} {\mathbf{#1}} } \)
\( \newcommand{\vectorC}[1]{\textbf{#1}} \)
\( \newcommand{\vectorD}[1]{\overrightarrow{#1}} \)
\( \newcommand{\vectorDt}[1]{\overrightarrow{\text{#1}}} \)
\( \newcommand{\vectE}[1]{\overset{-\!-\!\rightharpoonup}{\vphantom{a}\smash{\mathbf {#1}}}} \)
\( \newcommand{\vecs}[1]{\overset { \scriptstyle \rightharpoonup} {\mathbf{#1}} } \)
\(\newcommand{\longvect}{\overrightarrow}\)
\( \newcommand{\vecd}[1]{\overset{-\!-\!\rightharpoonup}{\vphantom{a}\smash {#1}}} \)
\(\newcommand{\avec}{\mathbf a}\) \(\newcommand{\bvec}{\mathbf b}\) \(\newcommand{\cvec}{\mathbf c}\) \(\newcommand{\dvec}{\mathbf d}\) \(\newcommand{\dtil}{\widetilde{\mathbf d}}\) \(\newcommand{\evec}{\mathbf e}\) \(\newcommand{\fvec}{\mathbf f}\) \(\newcommand{\nvec}{\mathbf n}\) \(\newcommand{\pvec}{\mathbf p}\) \(\newcommand{\qvec}{\mathbf q}\) \(\newcommand{\svec}{\mathbf s}\) \(\newcommand{\tvec}{\mathbf t}\) \(\newcommand{\uvec}{\mathbf u}\) \(\newcommand{\vvec}{\mathbf v}\) \(\newcommand{\wvec}{\mathbf w}\) \(\newcommand{\xvec}{\mathbf x}\) \(\newcommand{\yvec}{\mathbf y}\) \(\newcommand{\zvec}{\mathbf z}\) \(\newcommand{\rvec}{\mathbf r}\) \(\newcommand{\mvec}{\mathbf m}\) \(\newcommand{\zerovec}{\mathbf 0}\) \(\newcommand{\onevec}{\mathbf 1}\) \(\newcommand{\real}{\mathbb R}\) \(\newcommand{\twovec}[2]{\left[\begin{array}{r}#1 \\ #2 \end{array}\right]}\) \(\newcommand{\ctwovec}[2]{\left[\begin{array}{c}#1 \\ #2 \end{array}\right]}\) \(\newcommand{\threevec}[3]{\left[\begin{array}{r}#1 \\ #2 \\ #3 \end{array}\right]}\) \(\newcommand{\cthreevec}[3]{\left[\begin{array}{c}#1 \\ #2 \\ #3 \end{array}\right]}\) \(\newcommand{\fourvec}[4]{\left[\begin{array}{r}#1 \\ #2 \\ #3 \\ #4 \end{array}\right]}\) \(\newcommand{\cfourvec}[4]{\left[\begin{array}{c}#1 \\ #2 \\ #3 \\ #4 \end{array}\right]}\) \(\newcommand{\fivevec}[5]{\left[\begin{array}{r}#1 \\ #2 \\ #3 \\ #4 \\ #5 \\ \end{array}\right]}\) \(\newcommand{\cfivevec}[5]{\left[\begin{array}{c}#1 \\ #2 \\ #3 \\ #4 \\ #5 \\ \end{array}\right]}\) \(\newcommand{\mattwo}[4]{\left[\begin{array}{rr}#1 \amp #2 \\ #3 \amp #4 \\ \end{array}\right]}\) \(\newcommand{\laspan}[1]{\text{Span}\{#1\}}\) \(\newcommand{\bcal}{\cal B}\) \(\newcommand{\ccal}{\cal C}\) \(\newcommand{\scal}{\cal S}\) \(\newcommand{\wcal}{\cal W}\) \(\newcommand{\ecal}{\cal E}\) \(\newcommand{\coords}[2]{\left\{#1\right\}_{#2}}\) \(\newcommand{\gray}[1]{\color{gray}{#1}}\) \(\newcommand{\lgray}[1]{\color{lightgray}{#1}}\) \(\newcommand{\rank}{\operatorname{rank}}\) \(\newcommand{\row}{\text{Row}}\) \(\newcommand{\col}{\text{Col}}\) \(\renewcommand{\row}{\text{Row}}\) \(\newcommand{\nul}{\text{Nul}}\) \(\newcommand{\var}{\text{Var}}\) \(\newcommand{\corr}{\text{corr}}\) \(\newcommand{\len}[1]{\left|#1\right|}\) \(\newcommand{\bbar}{\overline{\bvec}}\) \(\newcommand{\bhat}{\widehat{\bvec}}\) \(\newcommand{\bperp}{\bvec^\perp}\) \(\newcommand{\xhat}{\widehat{\xvec}}\) \(\newcommand{\vhat}{\widehat{\vvec}}\) \(\newcommand{\uhat}{\widehat{\uvec}}\) \(\newcommand{\what}{\widehat{\wvec}}\) \(\newcommand{\Sighat}{\widehat{\Sigma}}\) \(\newcommand{\lt}{<}\) \(\newcommand{\gt}{>}\) \(\newcommand{\amp}{&}\) \(\definecolor{fillinmathshade}{gray}{0.9}\)LEARNING OBJECTIVE
- Analyze cash flow information.
Question: Companies and analysts tend to use income statement and balance sheet information to evaluate financial performance. In fact, financial results presented to the investing public typically focus on earnings per share (Chapter 13 discusses earnings per share in detail). However, analysis of cash flow information is becoming increasingly important to managers, auditors, and outside analysts. What measures are commonly used to evaluate performance related to cash flows?
Answer: Three common cash flow measures used to evaluate organizations are (1) operating cash flow ratio, (2) capital expenditure ratio, and (3) free cash flow. (Further coverage of these measures can be found in the following article: John R. Mills and Jeanne H. Yamamura, “The Power of Cash Flow Ratios,” Journal of Accountancy, October 1998.) We will use two large home improvement retail companies, The Home Depot, Inc., and Lowe’s Companies, Inc., to illustrate these measures.
Operating Cash Flow Ratio
Question: The operating cash flow ratio is cash provided by operating activities divided by current liabilities. What does this ratio tell us, and how is it calculated?
Answer: This ratio measures the company’s ability to generate enough cash from daily operations over the course of a year to cover current obligations. Although similar to the commonly used current ratio, this ratio replaces current assets in the numerator with cash provided by operating activities. The operating cash flow ratio is as follows:
Key Equation
The numerator, cash provided by operating activities, comes from the bottom of the operating activities section of the statement of cash flows. The denominator, current liabilities, comes from the liabilities section of the balance sheet. (Note that if current liabilities vary significantly from one period to the next, some analysts prefer to use average current liabilities. We will use ending current liabilities unless noted otherwise.)
As with most financial measures, the resulting ratio must be compared to similar companies in the industry to determine whether the ratio is reasonable. Some industries have a large operating cash flow relative to current liabilities (e.g., mature computer chip makers, such as Intel Corporation), while others do not (e.g., startup medical device companies).
The operating cash flow ratio is calculated for Home Depot and Lowe’s in the following using information from each company’s balance sheet and statement of cash flows.
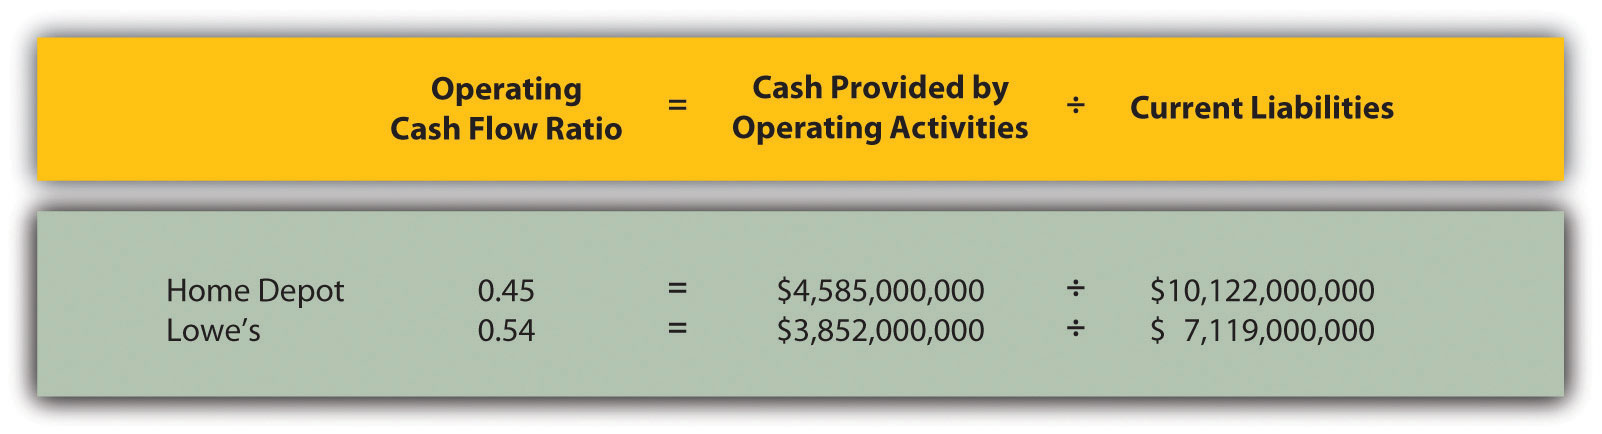
Home Depot and Lowe’s are in the same industry and have comparable ratios, which is what we would expect for similar companies.
Capital Expenditure Ratio
Question: The capital expenditure ratio is cash provided by operating activities divided by capital expenditures. What does this ratio tell us, and how is it calculated?
Answer: This ratio measures the company’s ability to generate enough cash from daily operations to cover capital expenditures. A ratio in excess of 1.0, for example, indicates the company was able to generate enough operating cash to cover investments in property, plant, and equipment. The capital expenditure ratio is as follows:
Key Equation
The numerator, cash provided by operating activities, comes from the bottom of the operating activities section of the statement of cash flows. The denominator, capital expenditures, comes from information within the investing activities section of the statement of cash flows.
The capital expenditure ratio is calculated for Home Depot and Lowe’s in the following using information from each company’s statement of cash flows.
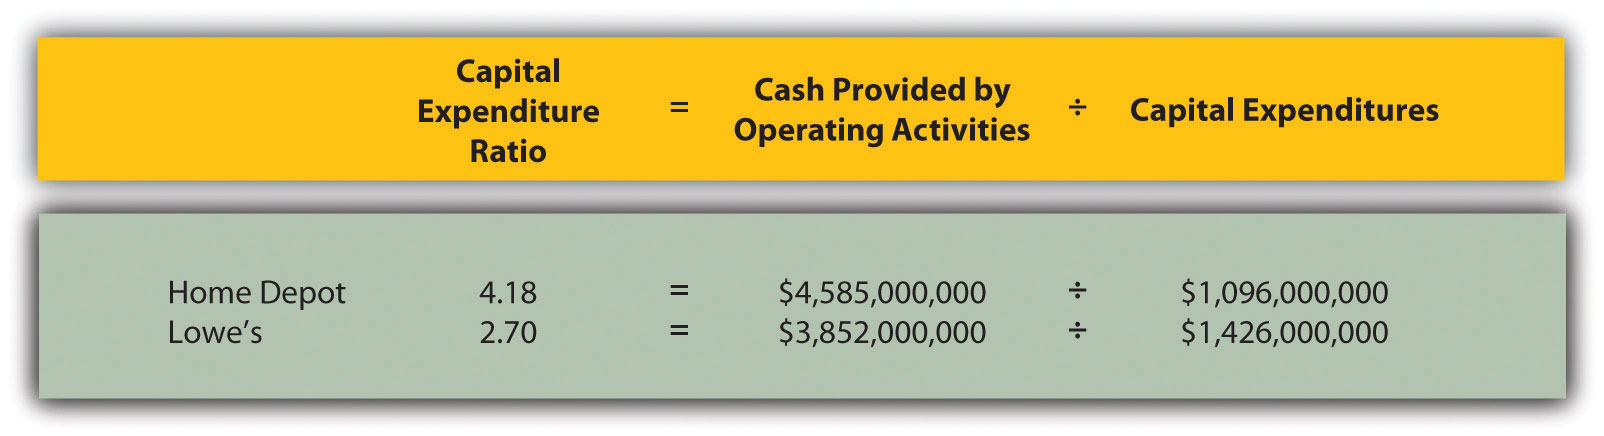
Since the capital expenditure ratio for each company is above 1.0, both companies were able to generate enough cash from operating activities to cover investments in property, plant, and equipment (also called fixed assets).
Free Cash Flow
Question: Another measure used to evaluate organizations, called free cash flow, is simply a variation of the capital expenditure ratio described previously. What does this measure tell us, and how is it calculated?
Answer: Rather than using a ratio to determine whether the company generates enough cash from daily operations to cover capital expenditures, free cash flow is measured in dollars. Free cash flow is cash provided by operating activities minus capital expenditures. The idea is that companies must continue to invest in fixed assets to remain competitive. Free cash flow provides information regarding how much cash generated from daily operations is left over after investing in fixed assets. Many organizations, such as Amazon.com, consider this measure to be one of the most important in evaluating financial performance (see Note 12.34 "Business in Action 12.5"). The free cash flow formula is as follows:
Key Equation
Free cash flow = Cash provided by operating activities − Capital expenditures
The cash provided by operating activities comes from the bottom of the operating activities section of the statement of cash flows. The capital expenditures amount comes from information within the investing activities section of the statement of cash flows.
The free cash flow amount is calculated for Home Depot and Lowe’s as follows using information from each company’s statement of cash flows.
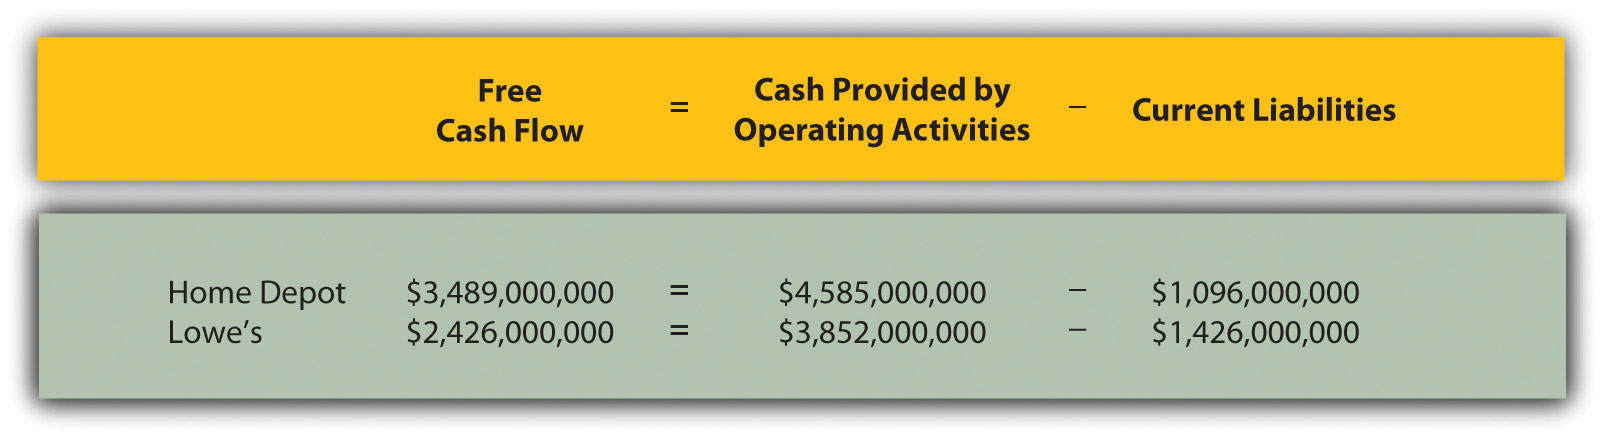
Because free cash flow for each company is above zero, both companies were able to generate enough cash from operating activities to cover investments in fixed assets and have some left over to invest elsewhere. This conclusion is consistent with the capital expenditure ratio analysis, which uses the same information to assess the company’s ability to cover fixed asset expenditures.
Formulas for the cash flow performance measures presented in this chapter are summarized in Table 12.1.
Table 12.1 Summary of Cash Flow Performance Measures
Business in Action 12.5

Source: Photo courtesy of James Duncan Davidson, http://www.flickr.com/photos/oreilly/6629275/
Free Cash Flow at Amazon.com
Amazon.com is an online retailer that began selling books in 1996 and has since expanded into other areas of retail sales. The founder and CEO (Jeff Bezos) believes free cash flow is so important, the annual report included a letter from Mr. Bezos to the shareholders, which began with this statement, “Our ultimate financial measure, and the one we want to drive over the long-term, is free cash flow per share.”
The company justifies this focus on free cash flow by making the point that earnings presented on the income statement do not translate into cash flows, and shares are valued based on the present value of future cash flows. This implies shareholders should be most interested in free cash flow per share rather than earnings per share. Mr. Bezos goes on to state, “Cash flow statements often don’t receive as much attention as they deserve. Discerning investors don’t stop with the income statement.”
Amazon.com’s free cash flow for 2010 totaled $2,164,000,000, compared to $2,880,000,000 in 2009. Net income for 2010 totaled $1,152,000,000, compared to $902,000,000 in 2009. It is interesting to note that free cash flow is significantly higher than net income for 2010 and 2009.
Source: Amazon.com, Inc., “2010 Annual Report,” www.amazon.com.
Key Takeaway
- Three measures are often used to evaluate cash flow. The operating cash flow ratio measures the company’s ability to generate enough cash from daily operations over the course of a year to cover current obligations. The formula is as follows:
The capital expenditure ratio measures the company’s ability to generate enough cash from daily operations to cover capital expenditures. The formula is as follows:
Free cash flow measures the company’s ability to generate enough cash from daily operations to cover capital expenditures and determines how much cash is remaining to invest elsewhere in the company. The formula is as follows:
Free cash flow = Cash provided by operating activities − Capital expenditures
REVIEW PROBLEM 12.8
The following financial information is for PepsiCo Inc. and Coca-Cola Company for fiscal year 2010.
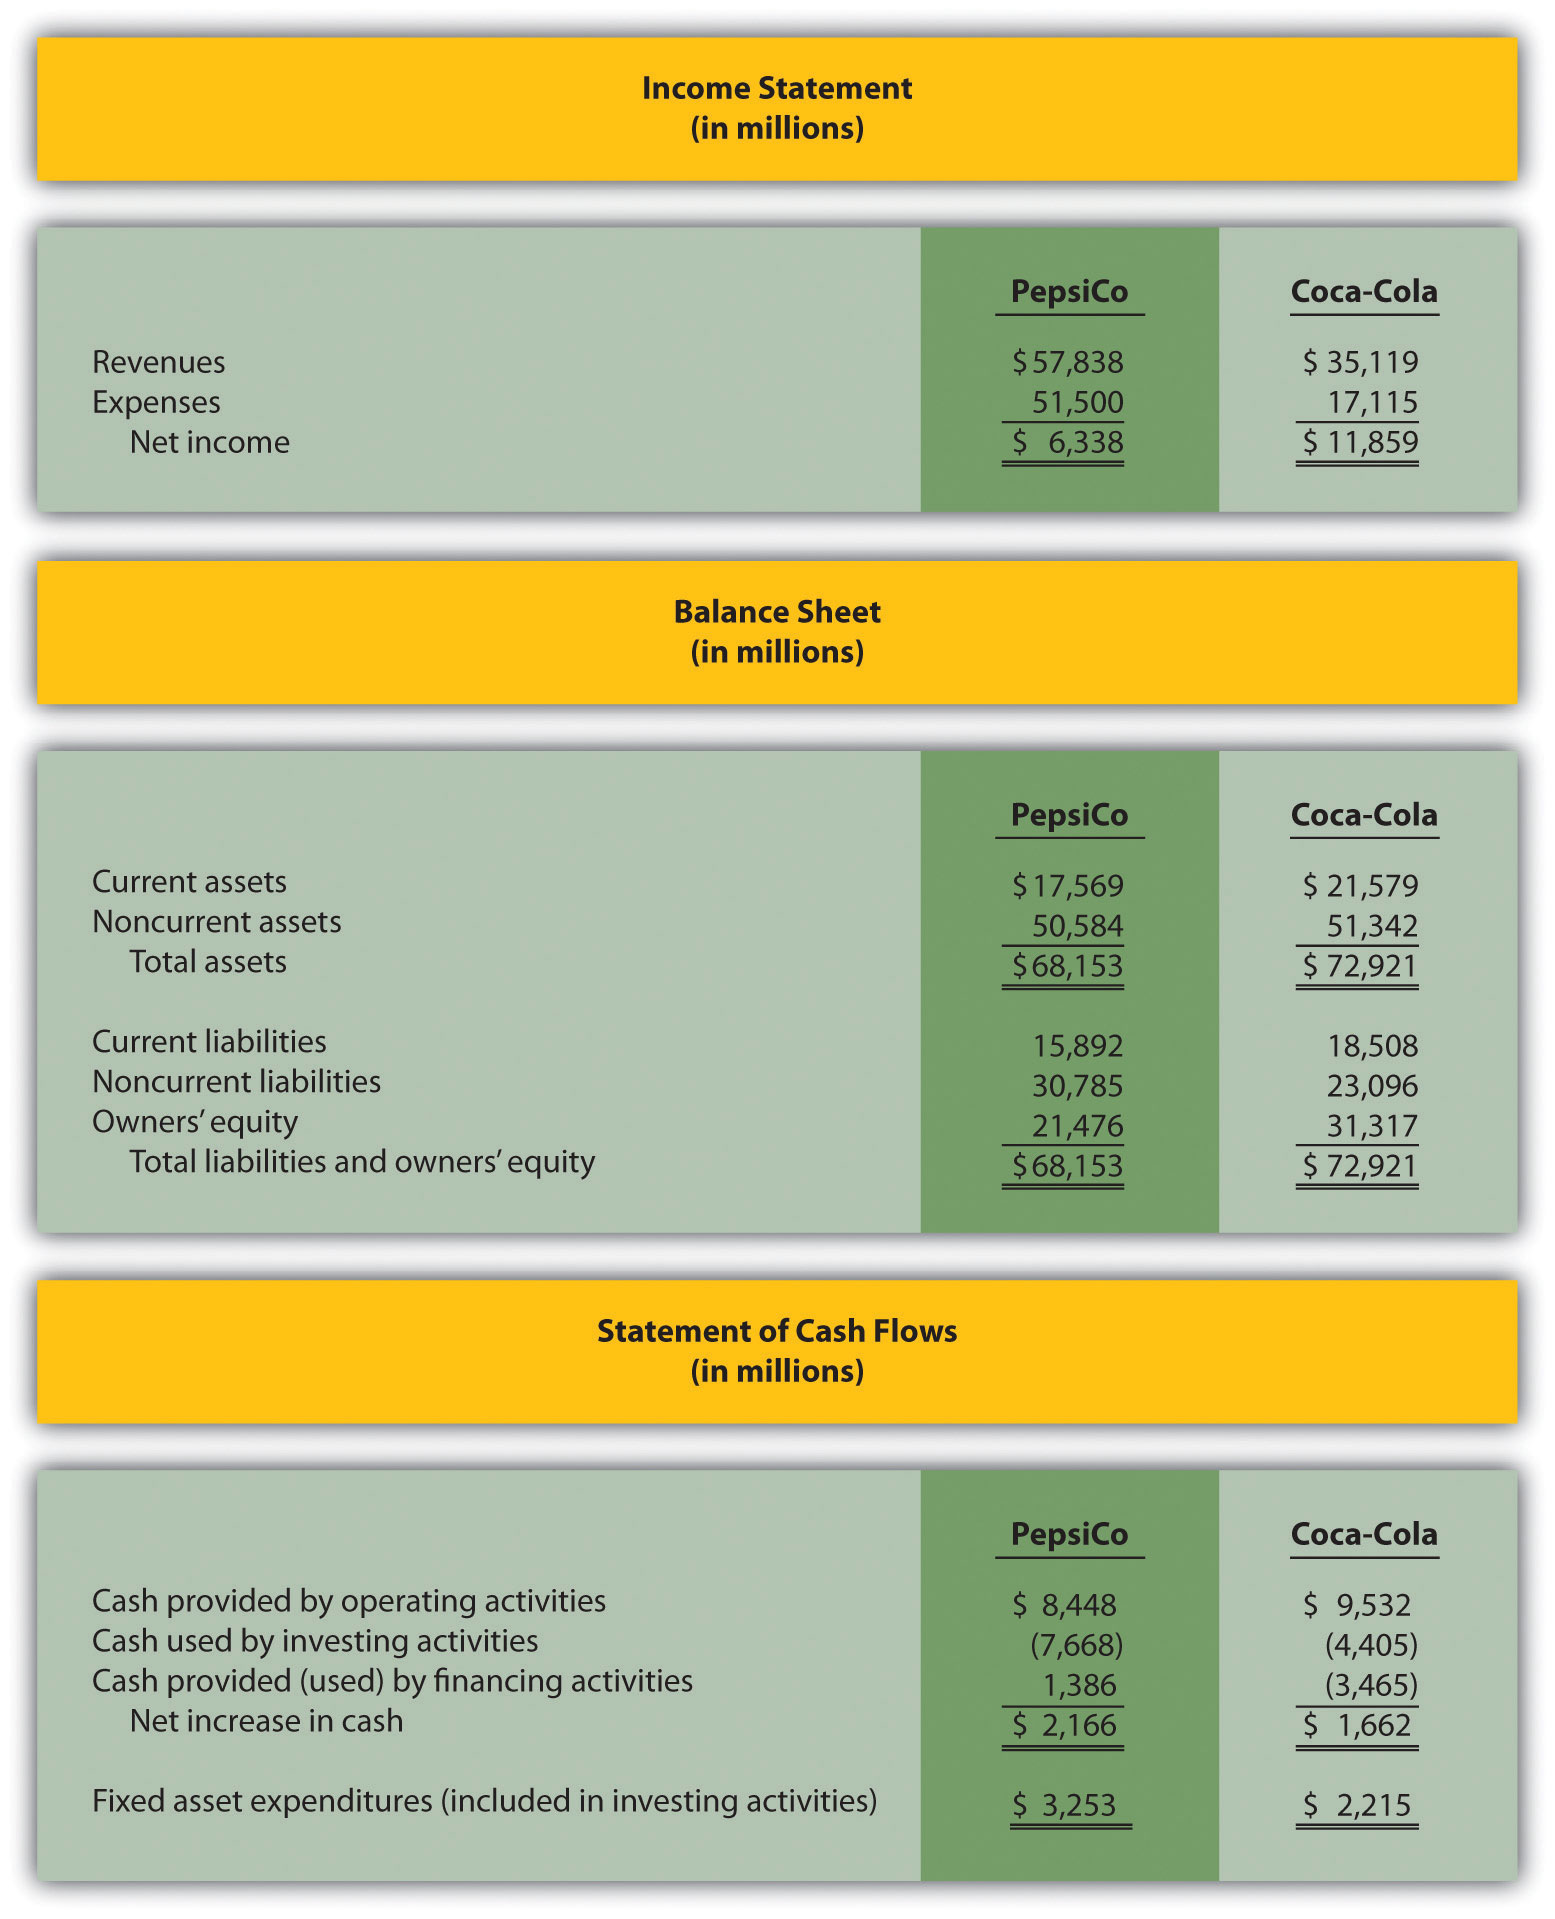
For PepsiCo and Coca-Cola, calculate the following measures and comment on your results:
- Operating cash flow ratio
- Capital expenditure ratio (Hint: fixed asset expenditures are the same as capital expenditures.)
- Free cash flow
Solution to Review Problem 12.8
All dollar amounts are in millions.
- The formula for calculating the operating cash flow ratio is as follows:
PepsiCo generated slightly more cash from operating activities to cover current liabilities than Coca-Cola.
- The formula for calculating the capital expenditure ratio is as follows:
Both companies generated more than enough cash from operating activities to cover capital expenditures.
- The formula to calculate free cash flow is as follows:
Free cash flow = Cash provided by operating activities − Capital expenditures
The conclusion reached in requirement two is confirmed here. Both companies generated more than enough cash from operating activities to cover capital expenditures. In fact, PepsiCo had $5,195,000,000 remaining from operating activities after investing in fixed assets, and Coca-Cola had $7,317,000,000 remaining.